Every dollar your inventory earns, in one live dashboard
PubThrive pulls your numbers straight from Google Ad Manager into one real-time view of revenue, performance, and payouts. And if you run an agency, you can share a customized version of it with every publisher and sub-agency you manage, without building a reporting tool of your own.
Revenue / today
$48,920
+12.4%
eCPM
$3.74
+6.1%
Fill rate
96.2%
+1.8%
Impressions
13.1M
+4.5%
Revenue
24hDemand mix
- Google AdX45%
- Amazon25%
- PubMatic17%
- Magnite13%
From GAM to your screen
Connected in three steps, then it just runs
Connect your Google Ad Manager
We map your GAM network so revenue flows in automatically. No manual exports, no spreadsheets.
We sync and normalize
Numbers are pulled from GAM, converted to USD server-side, and turned into metrics that actually add up.
You log in and see it live
Open the dashboard and your revenue, performance, and payouts are right there, current to the day.
What you get
Built to answer one question fast: where is my money?
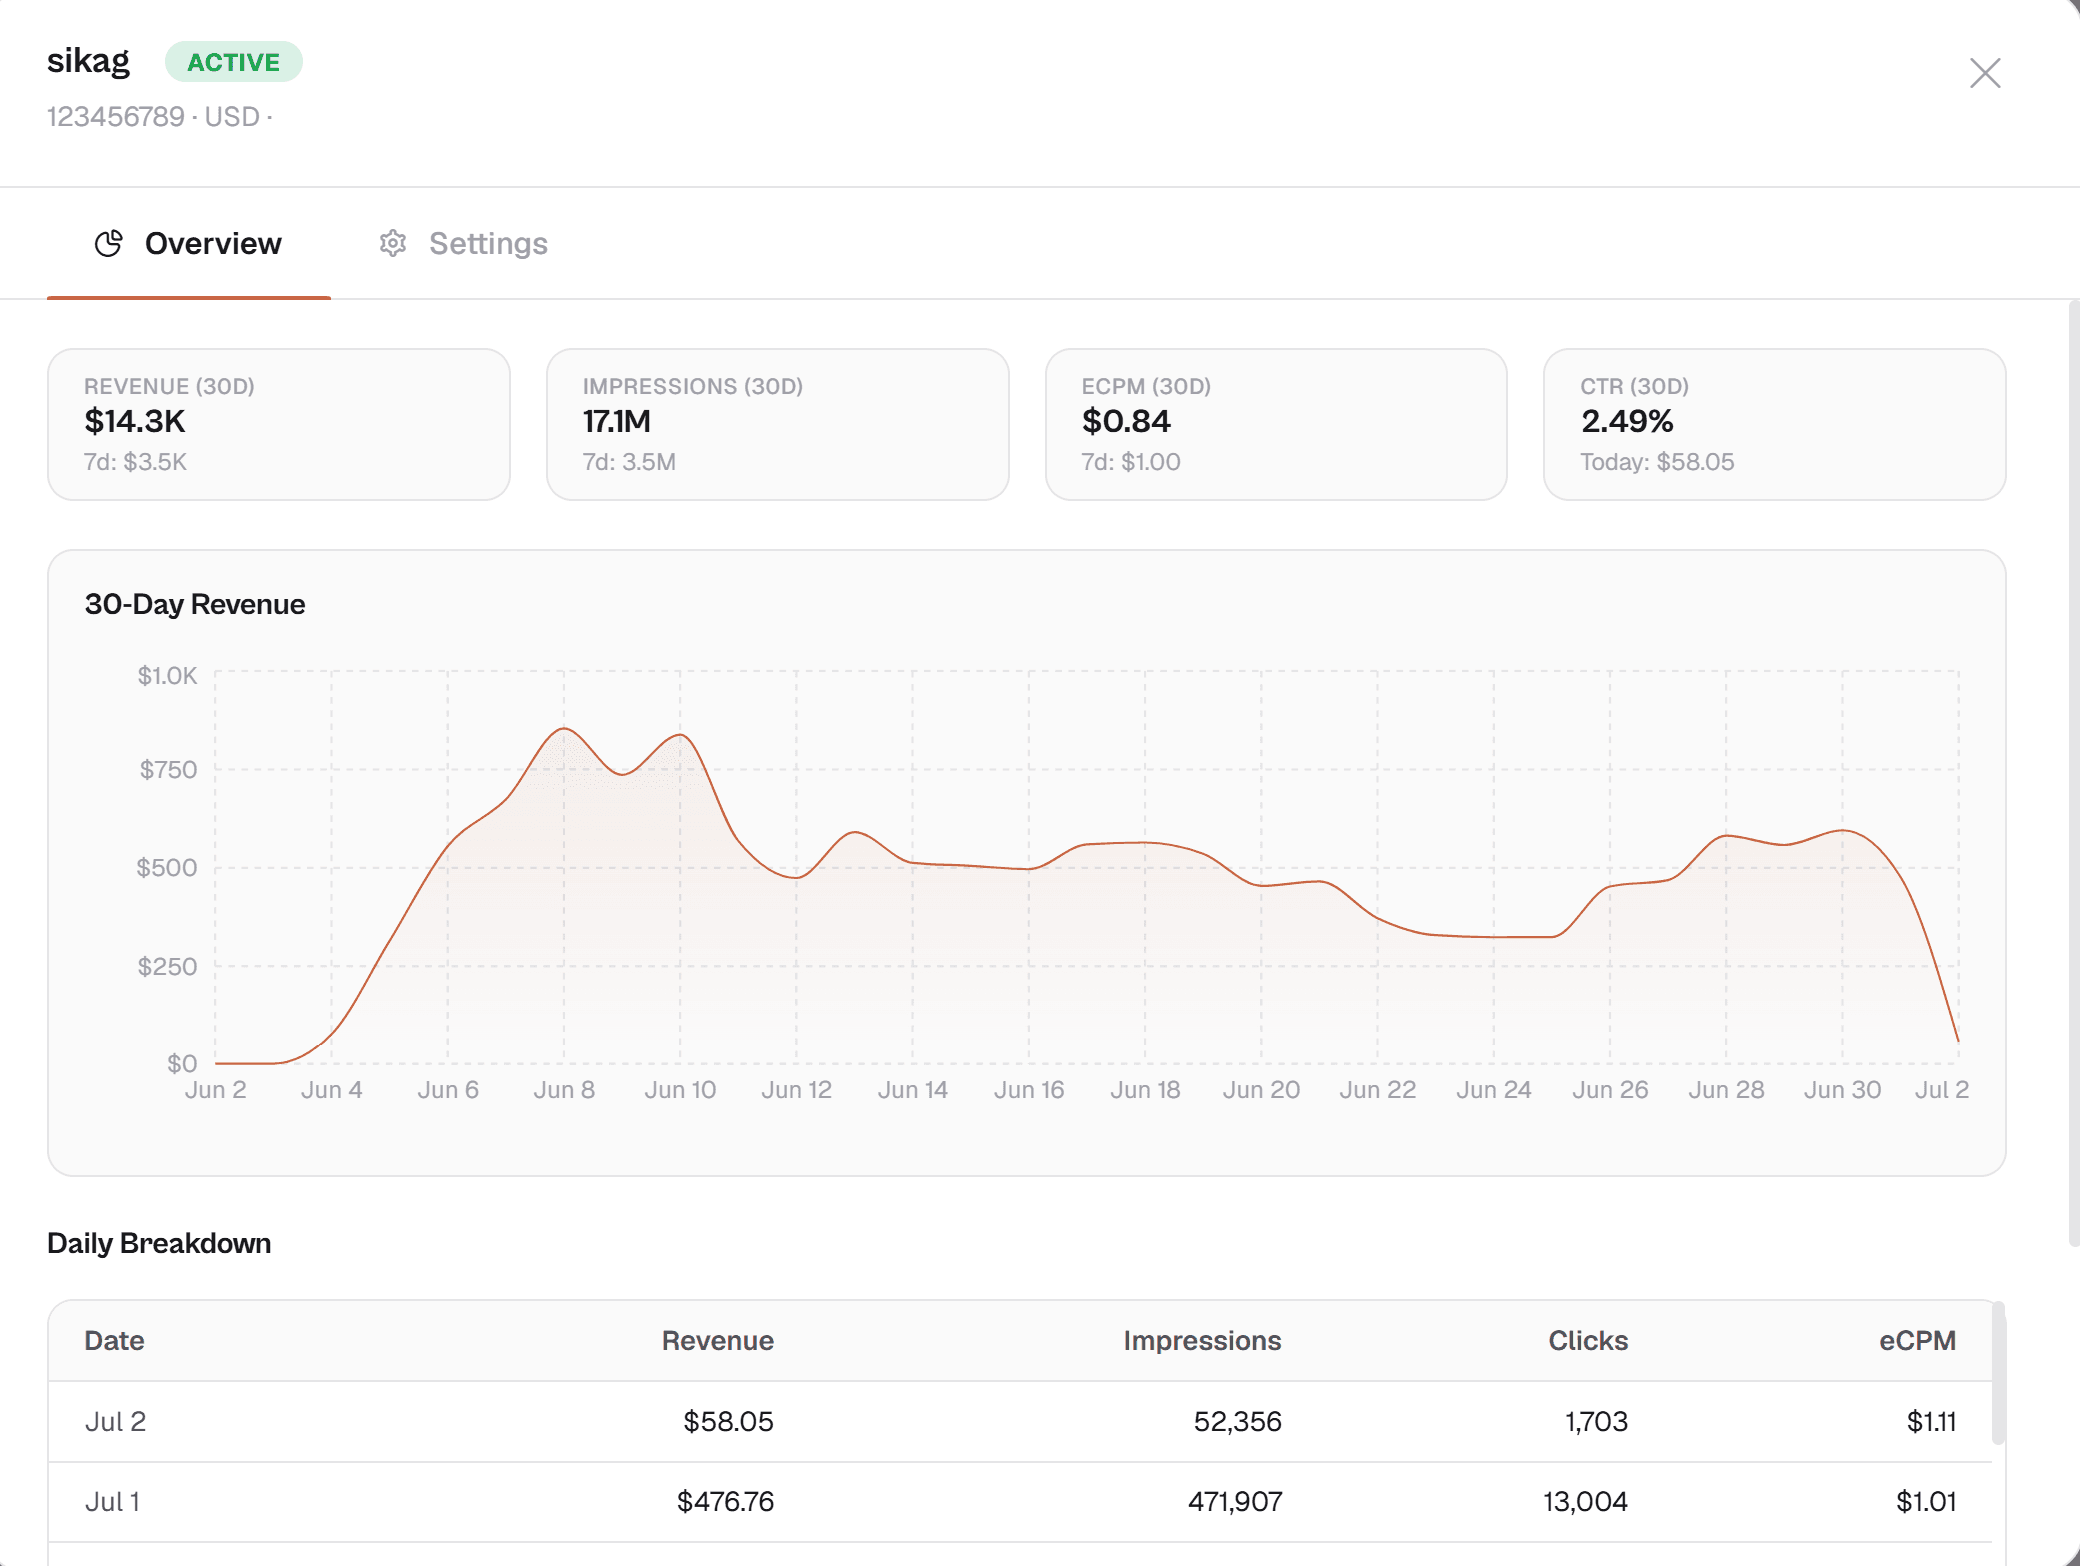
Reporting & analytics
Your revenue, live from Google Ad Manager
The moment you log in you see real numbers straight from GAM, not last night's export. Revenue, impressions, clicks, and ad requests, updated as the day runs.
- Today, Yesterday, 7-day, 30-day, and month-to-date, with a trend chart
- eCPM, CTR, fill rate, match rate, viewability, and unfilled impressions, all adding up correctly
- Revenue converted to USD automatically, with no messy currency math
- An interactive revenue chart and a demand-mix donut you can read at a glance
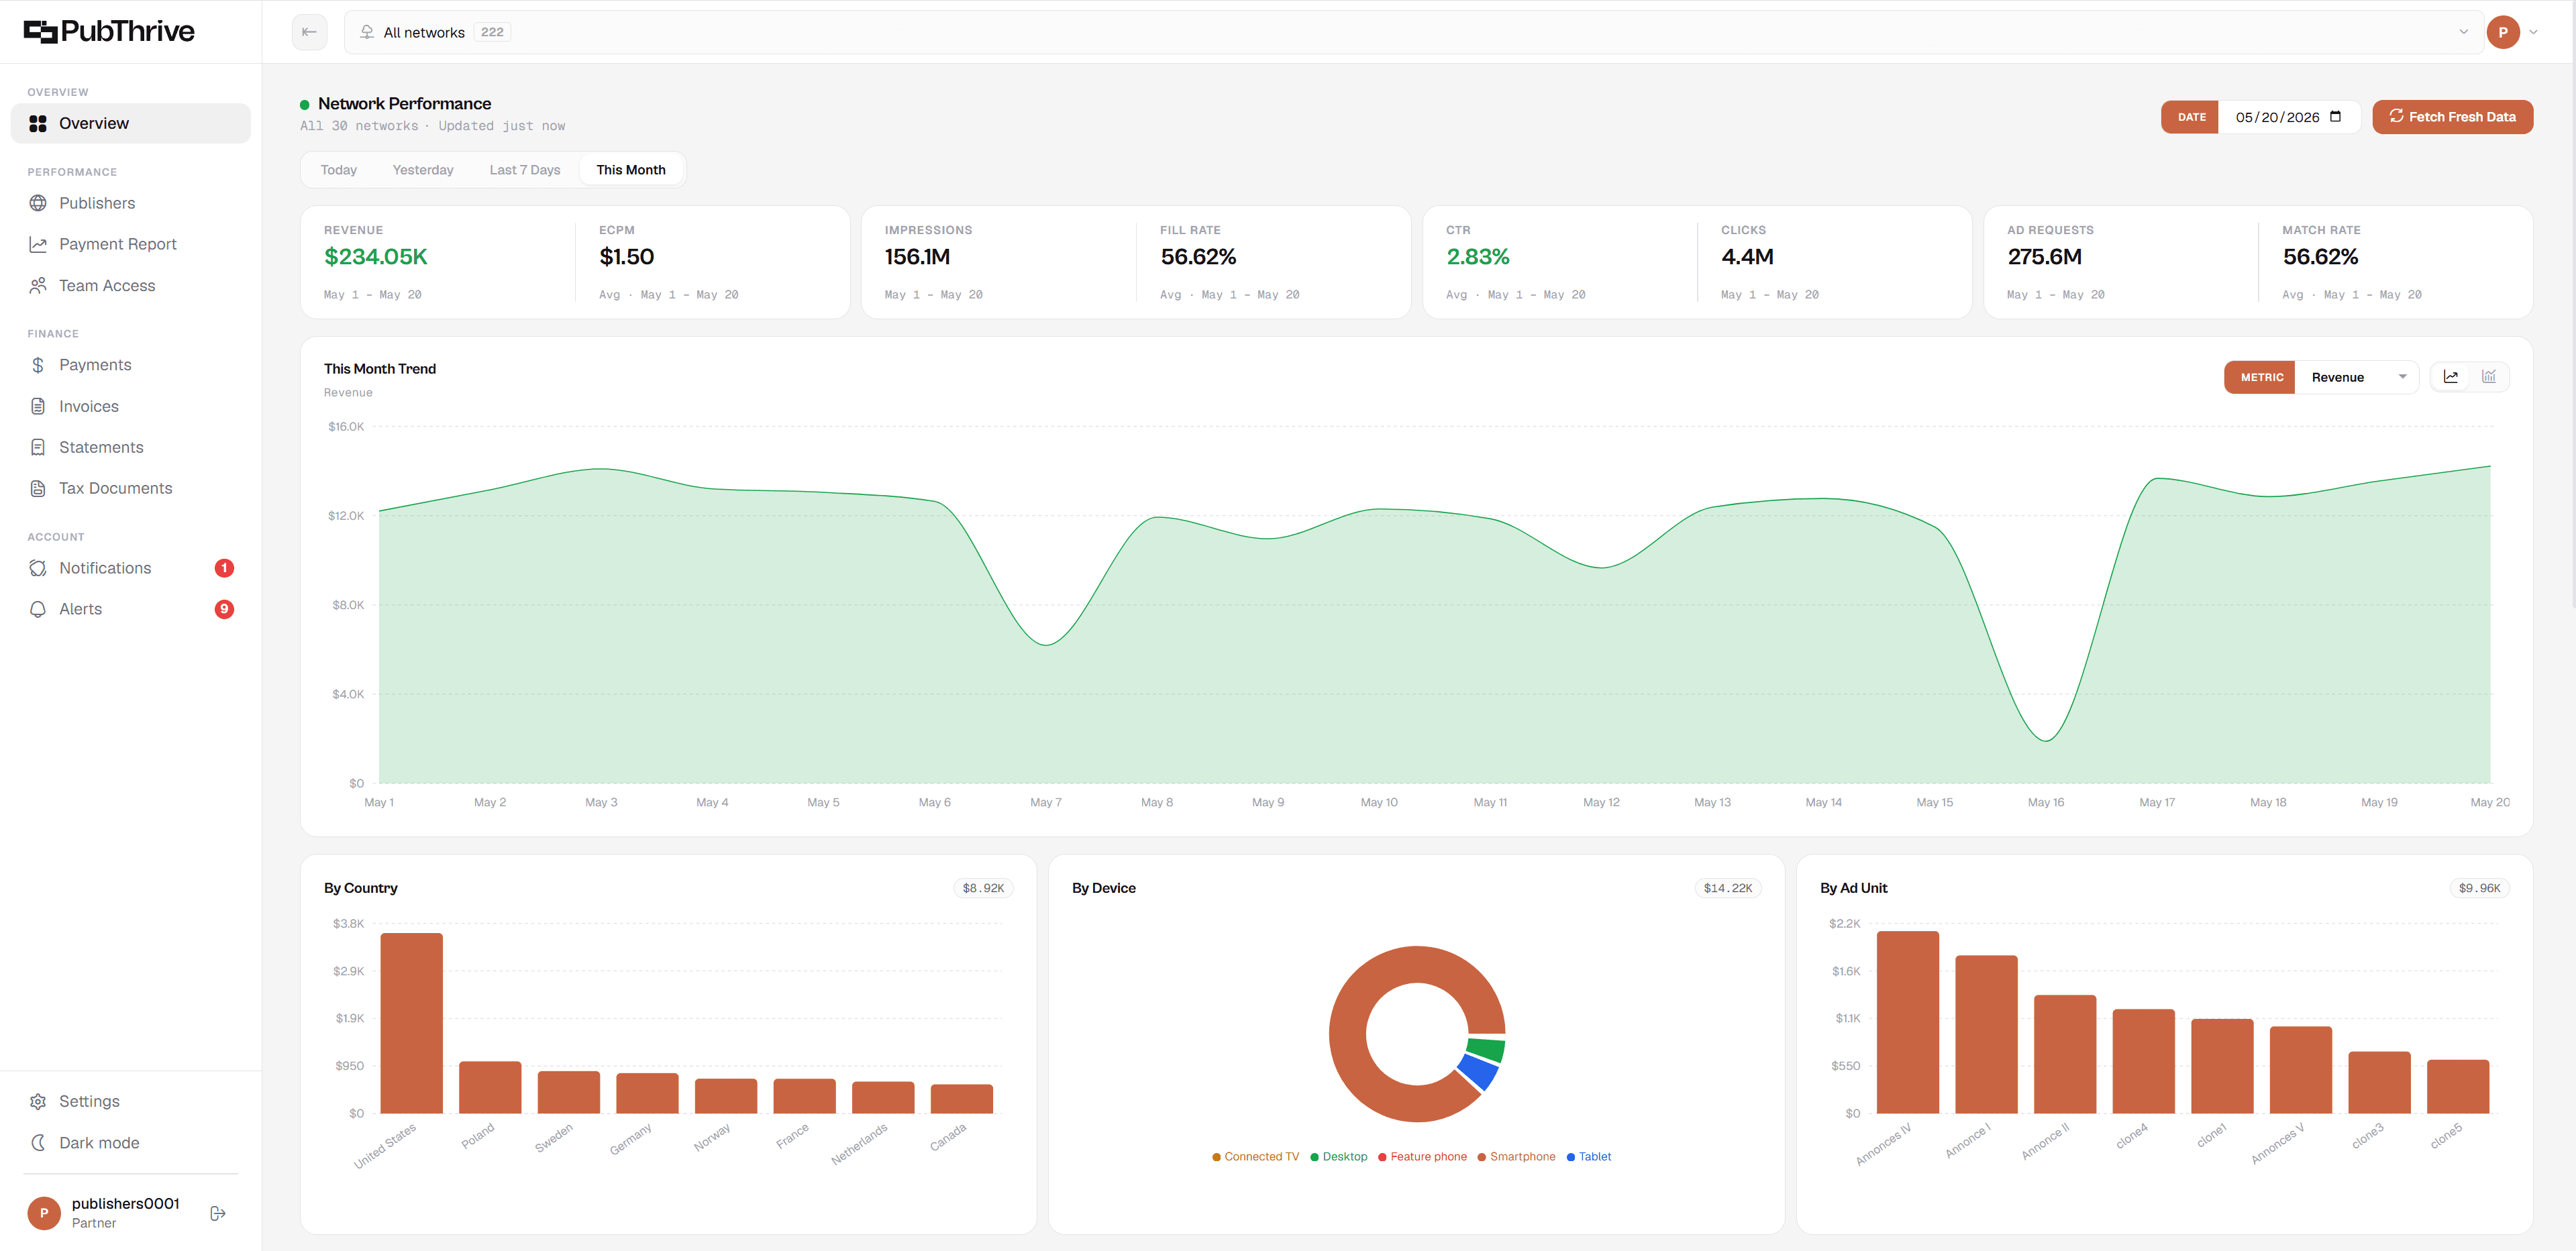
Breakdowns & drill-down
Slice it by site, country, device, or ad unit
See exactly where the money comes from. Break revenue down across your sites, geographies, devices, and ad units, then click any publisher row to open a full detail view.
- Breakdown widgets by site, country, device category, and ad unit
- Per-publisher drill-down with KPIs and a 30-day chart
- A network selector to focus on every site or just one
- Role-scoped data, so everyone sees exactly what they should and nothing more
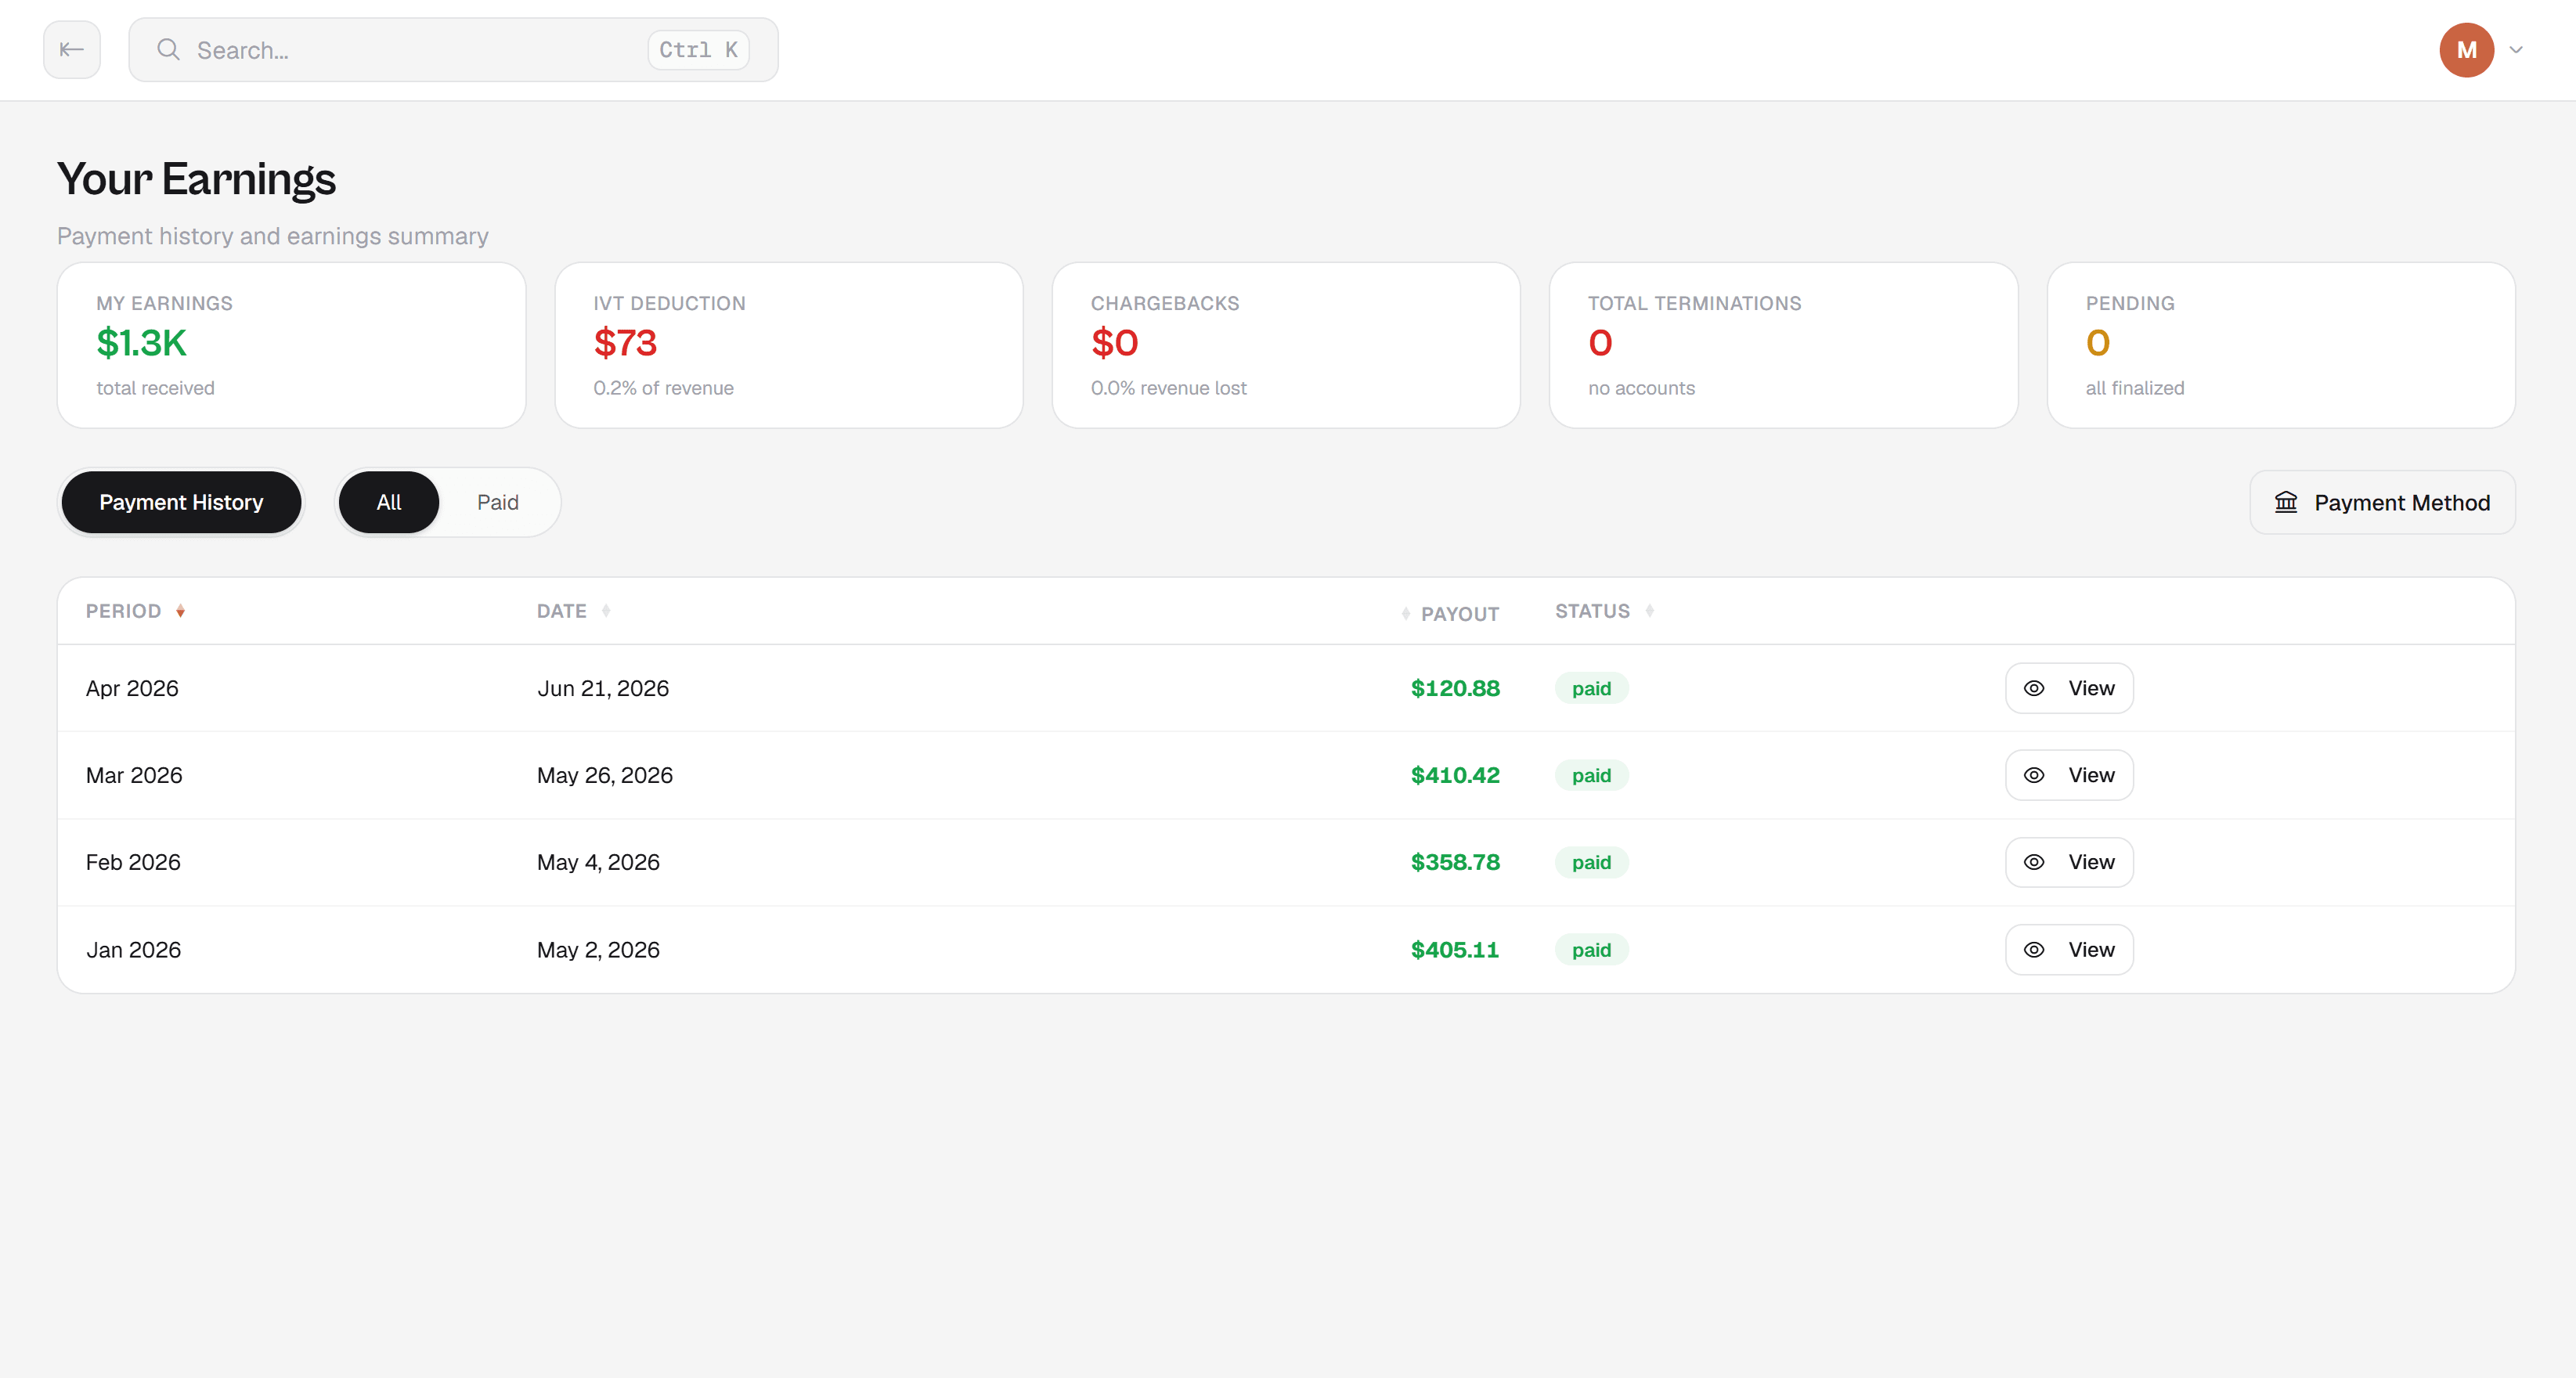
Payments & payouts
Payouts you can actually see coming
No black-box statements. Every payment is generated per partner, per month, with revenue auto-filled from your MCM sources and every adjustment shown in the open.
- Monthly payments with MCM revenue auto-filled and summed across sources
- Adjustments and chargebacks shown line by line, never buried
- Commission tiers, a preview before anything commits, and a clean approve-to-paid flow
- Exportable payment reports and an alert when a payout is on its way
Invoices, statements & tax
The finance paperwork, handled for you
The admin that usually eats your week is built in. Invoices generate themselves, statements stay current, and tax forms live in one place.
- Invoices that generate themselves the moment a payment is finalized
- An earnings ledger with running balance and lifetime, outstanding, and YTD totals
- Tax profile with signed W-9 / W-8BEN upload and a year-end earnings summary
- An earnings calculator that estimates your payout by commission tier
INV-2026-P12-07
Every headline number is built straight from your real Google Ad Manager data, so the details always line up with the totals:
Built for agencies & networks
Give your partners a dashboard, without building one
If you resell monetization to publishers or sub-agencies, each of them wants to see their own numbers. Instead of building and maintaining a reporting tool yourself, share ours. Manage every account in one place, then hand each publisher or sub-agency a customized, live view of just their inventory.
See every account in one place
Manage revenue across all your publishers and sub-agencies from a single view. Total earnings at the top, or drill into any one account, without juggling separate logins and spreadsheets.
Skip building your own dashboard
Stop paying to build and maintain a reporting tool for your partners. Share PubThrive's dashboard instead, and give them a polished, live view without writing a line of code.
Customize it per publisher or sub-agency
Decide exactly which accounts and numbers each publisher or sub-agency sees. Everyone gets a reporting-only view scoped to their own inventory, and nobody sees anyone else's.
White-label reporting
Share a customized dashboard in seconds
Pick which accounts a publisher or sub-agency should see, share it, and they get a live, reporting-only dashboard scoped to exactly those accounts. No building, no maintaining, no spreadsheets.
- Share with a single publisher or a whole sub-agency
- Customize exactly which accounts each one sees
- They get live numbers, you skip building any of it
Partner
You stay in control
Your numbers, shared only how you want
Revenue data is sensitive, so you hold the keys. Choose exactly who sees which accounts, and turn any login off the moment you need to. Nobody sees a number you did not give them.